Template Visualization Diagram
The Template Visualization Diagram is a powerful fool in our template system that allows you to visually comprehend the structure and relationships within your templates. It provides a UML-like representation of your templates, making it easier to grasp the overall design and properties associated with each entity. In this article, we will explain the different components of the diagram and how to interpret them.
Entity Representation
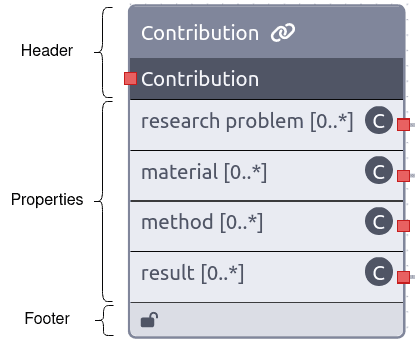
Each entity in the diagram corresponds to a template in the ORKG. The entity consists of three main sections: the header, the properties section, and the footer.
Header
The header of an entity displays the template name at the top, followed by its associated target class. The template name provides a descriptive title for the entity, while the target class indicates the class or type that the template is intended for. This ordering allows you to easily identify the template’s name and its corresponding target class, providing clear context and understanding of the template.
Properties Section
The properites section, located in the middle of the entity, provides essential information about the template’s properties. Each property is representaed by three elements: label, cardinality, and range.
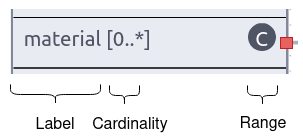
Label
The label represents the name of the property. It gives you an indication of the type of information that can be captured by that property.
Cardinality
The cardinality of a property specifies how many values can be associated with it. It indicates whether the property allows a single value or multiple values. The cardinality is represented as a number or a range, such as 0..1 (optional), 1..1 (mandatory), or 0..* (mulitple values allowed).
Footer
The footer of an entity is a small icon that provides additional information about the template. It indicates whether the template is closed or not. A closed template means that no further properties can be added to it, while an open template allows for additional properties to be defined.
Understanding the Diagram
By examining the Template Visualization Diagram, you can quickly understand the structure of your templates, the properties they contain, and the relationships between different entities. This visual representation simplifies the process of analyzing and designing templates, enabling you to create and modify them with ease.