Using the Graph View - A knowledge graph visualization tool
Knowledge graphs are a powerful way to represent and organize information as a network of interconnected entities (nodes) and their relationships (edges). The ORKG offers a tool to visualize the graph structure of a paper in the system. This tutorial shows you how to operate this tool to aid you in the usage of the ORKG.
Where you can find the Graph View
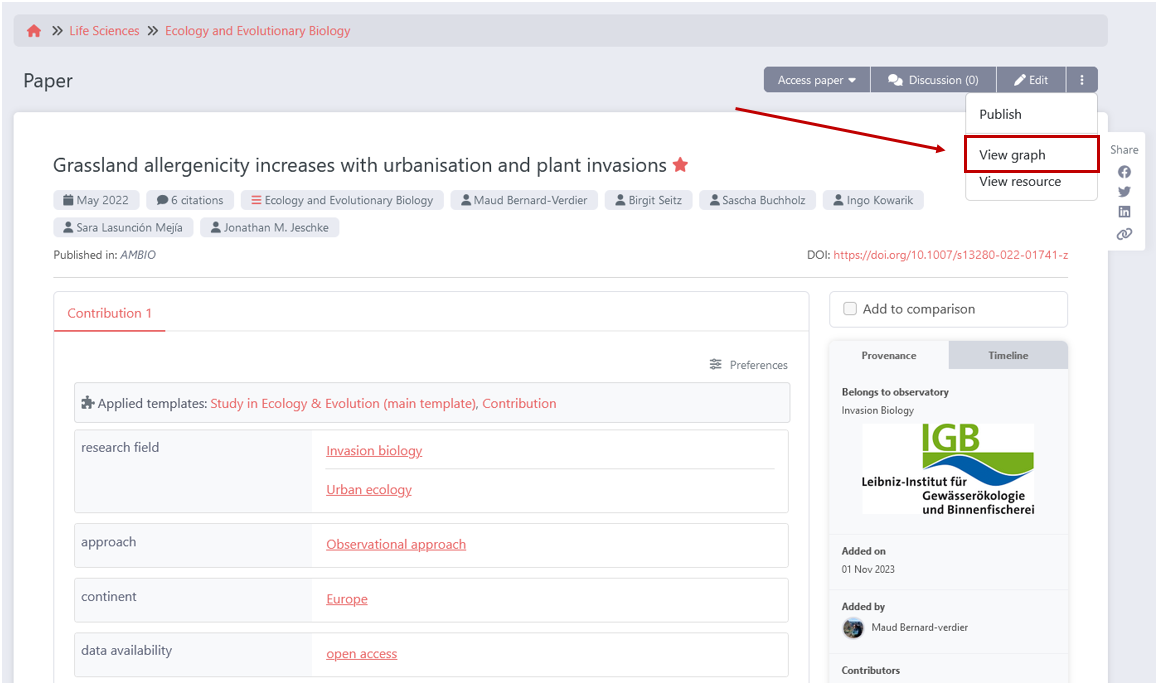
Open the Paper View of the paper that you are interested in. Click on the three dots on the top right and then choose View graph.
Components of the Graph
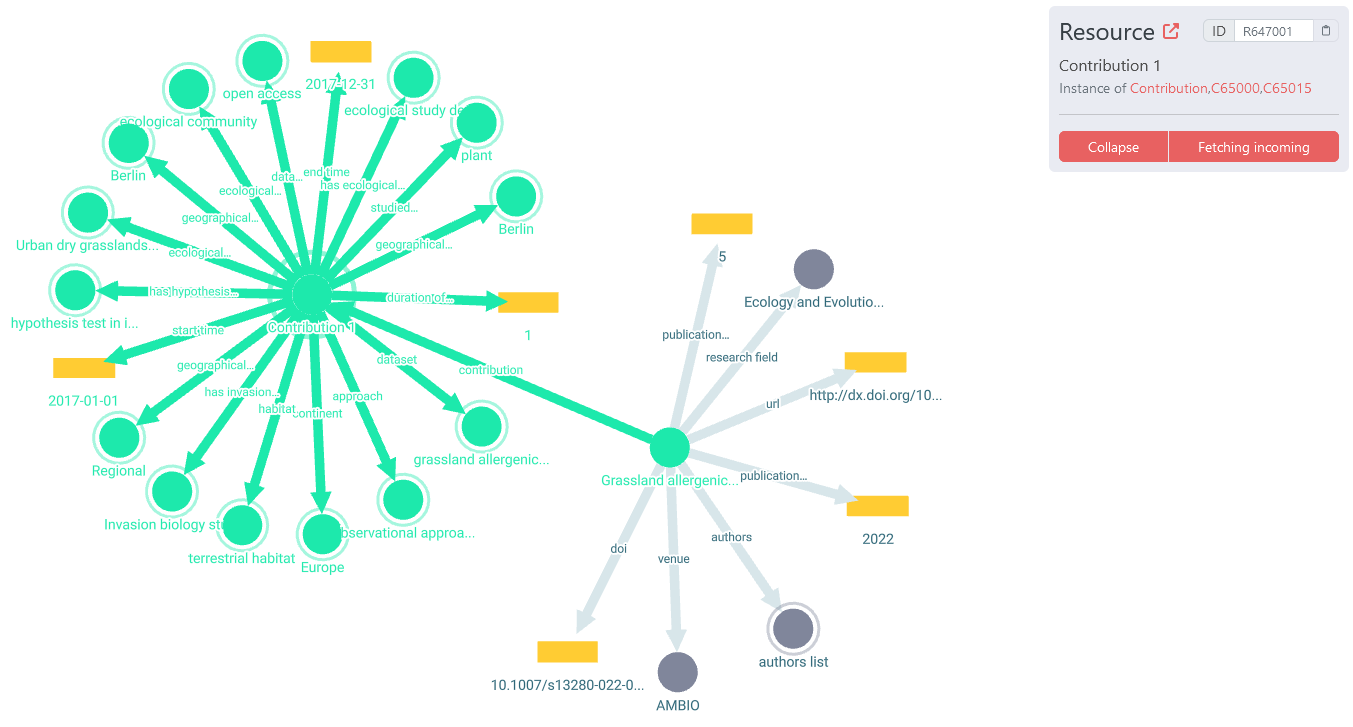
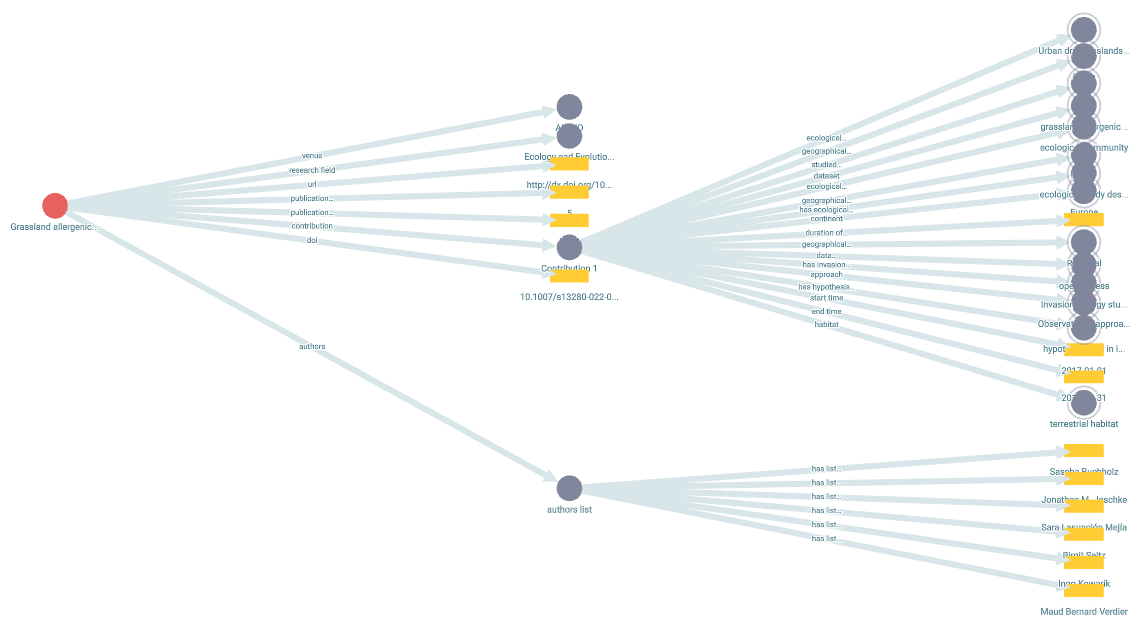
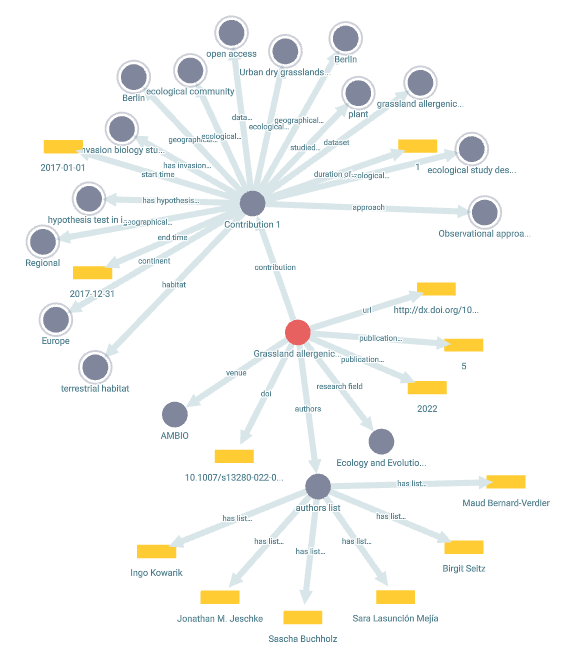
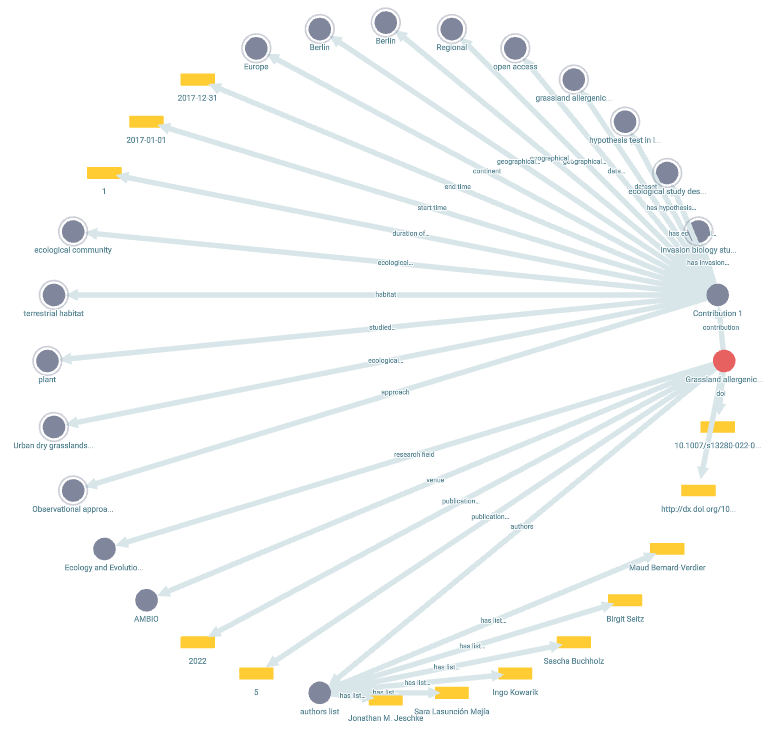
When you open the graph view, you will see a visualization of the underlying graph structure of the chosen paper.
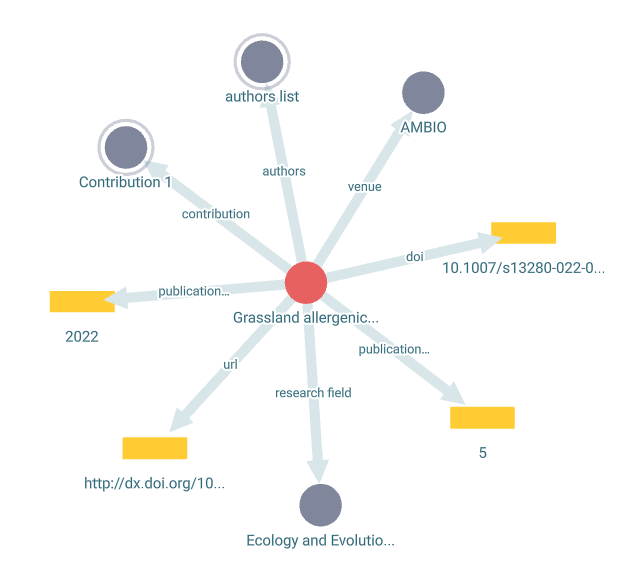
The red circle represents the node of the chosen paper. The grey circles represent nodes, which are resources. If they have another outer circle around themselves, that means that they are expandable by clicking on them. The yellow rectangles represent literals and the arrows connecting the nodes are the edges or relationships. You always read the graph in the direction of the arrows, e.g. the paper "Grassland allergenicity increases with urbanisation and plant invasions" has the publication year 2022.
Graph View Features
This knowledge graph visualization tool has many features that can help you explore the ORKG and gather valuable information about the ORKG’s data.
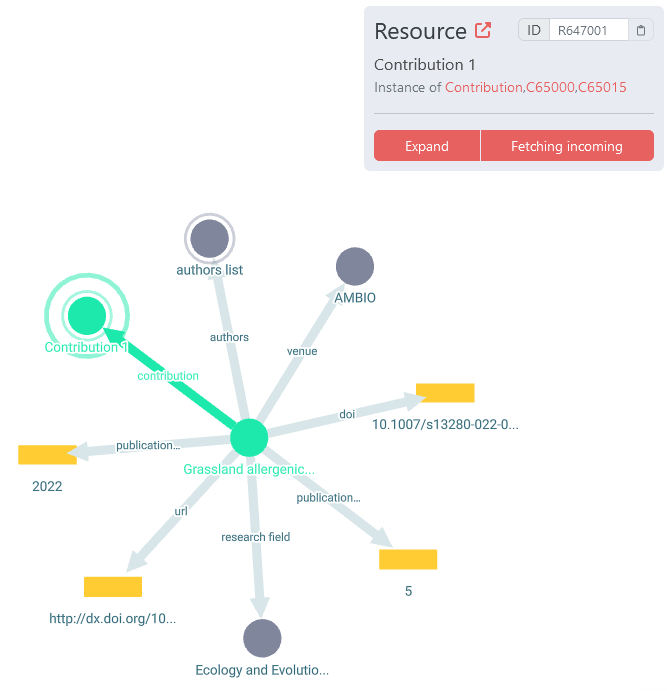
Exploring node information
Left click on a node or edge and in the upper right corner you will find all relevant information about the clicked node or edge. This includes whether the node is a resource or literal, the ID of the node or edge, the label and the broader class of a resource.
:
Expand, Collaps and Fetch incoming
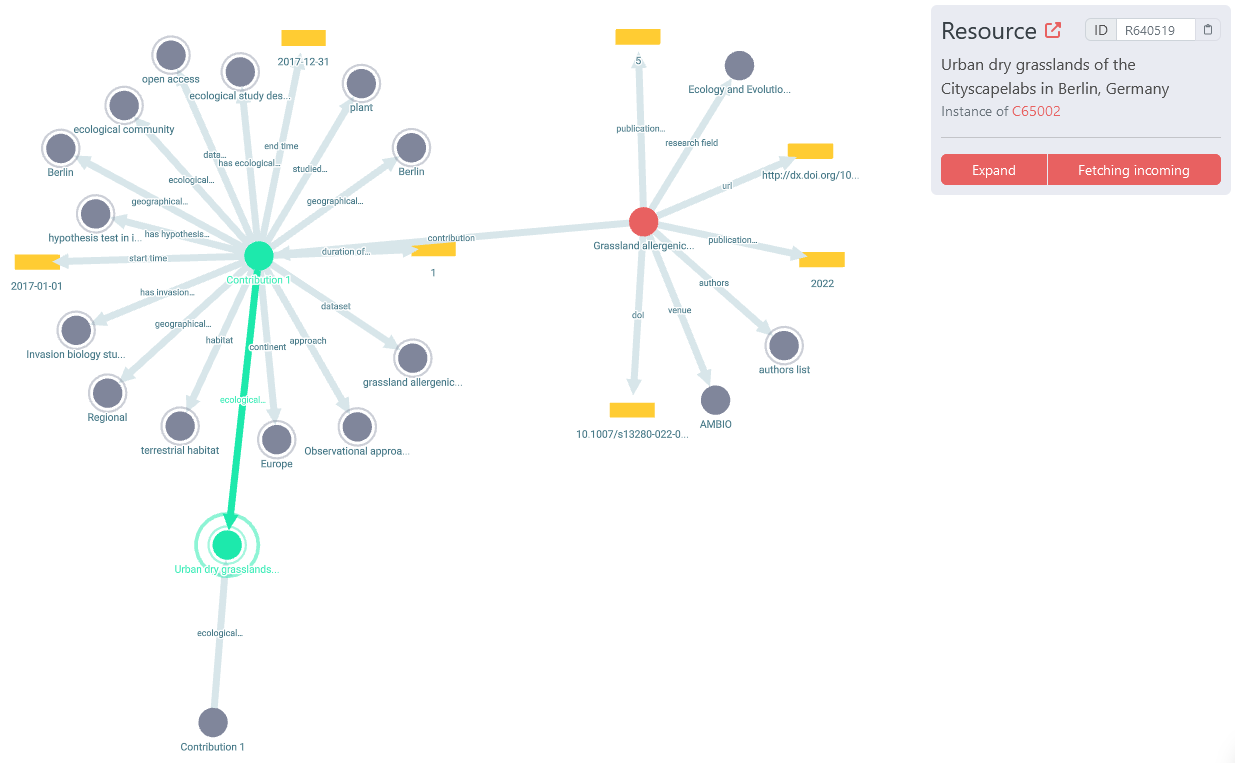
For most resources you have more options than just looking at the node information. Right clicking a node will open a menu with various options.
: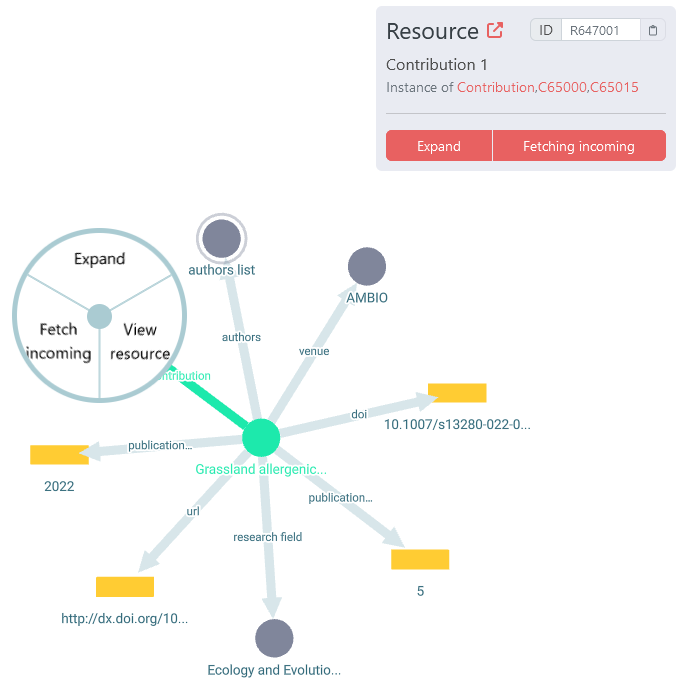
Expand
This option is only available for resources with a grey outer circle. Clicking on it will display all outgoing edges and their destination nodes.
:
Collapse
This option is available for resources with outgoing edges. Clicking on it will hide all outgoing edges and their destination nodes.
Fetch incoming
This option will display all incoming edges and their source nodes.
:
Zooming
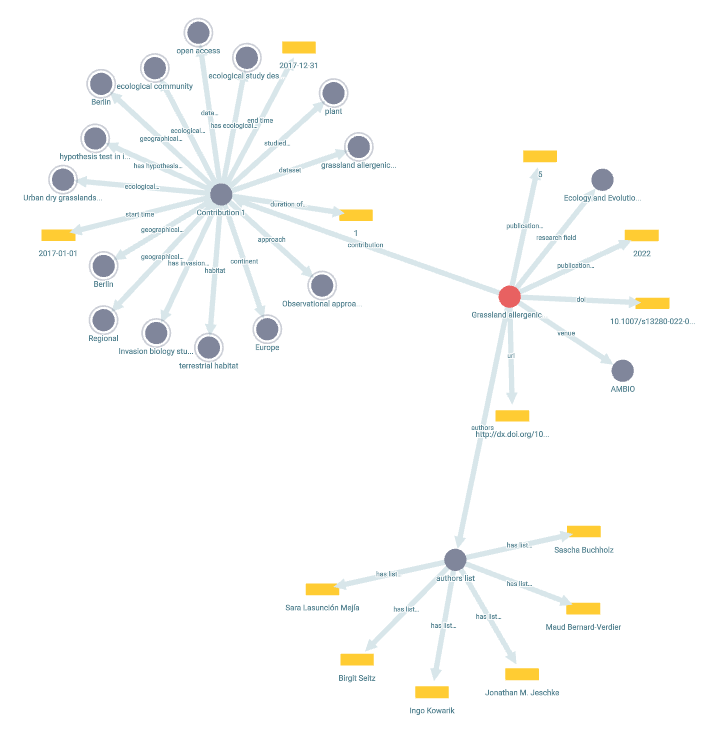
You can use your mouse wheel to scroll in and out of the graph. A closer look can help you to get every detail on a specific area of the graph, while a zoomed-out view can provide a broader perspective of the entire graph.
Graph Layouts
On the top bar of the graph view, there is a button labelled Layout that gives you the option of ordering the nodes and edges of the graph visualization in a certain way.
Force Directed
The default option of the graph view.
:
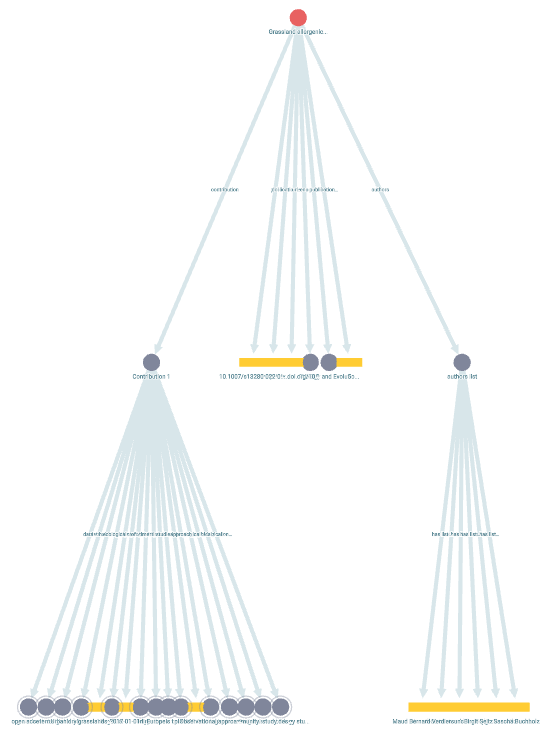
Vertical
A vertical tree-like structure.
:
Horizontal
A horizontal tree-like structure.
:
Radial
An outwards directed radial structure.
:
Circular
All nodes form a circle with the edges in between.
:
Recentering the Graph
Sometimes, while exploring the graph, you might get lost in between all the nodes and edges. The Center graph button on the top bar of the graph view will center the graph in the middle of window again.
Changing the Graph Depth
Depending on your interests, you might want to look at the graph at various depths. You can do so by changing the number in the Depth labelled input field in the top bar.
Blacklisting classes
If you want to remove resources of specific classes from the graph view, you can do so by blacklisting them. For this, click on the wrench icon in the top bar and enter the name of the class you want to blacklist. The auto-complete function will help you to find the right class.
What next?
-
You can check out the graph view for your own paper! Learn how to enter it here.